


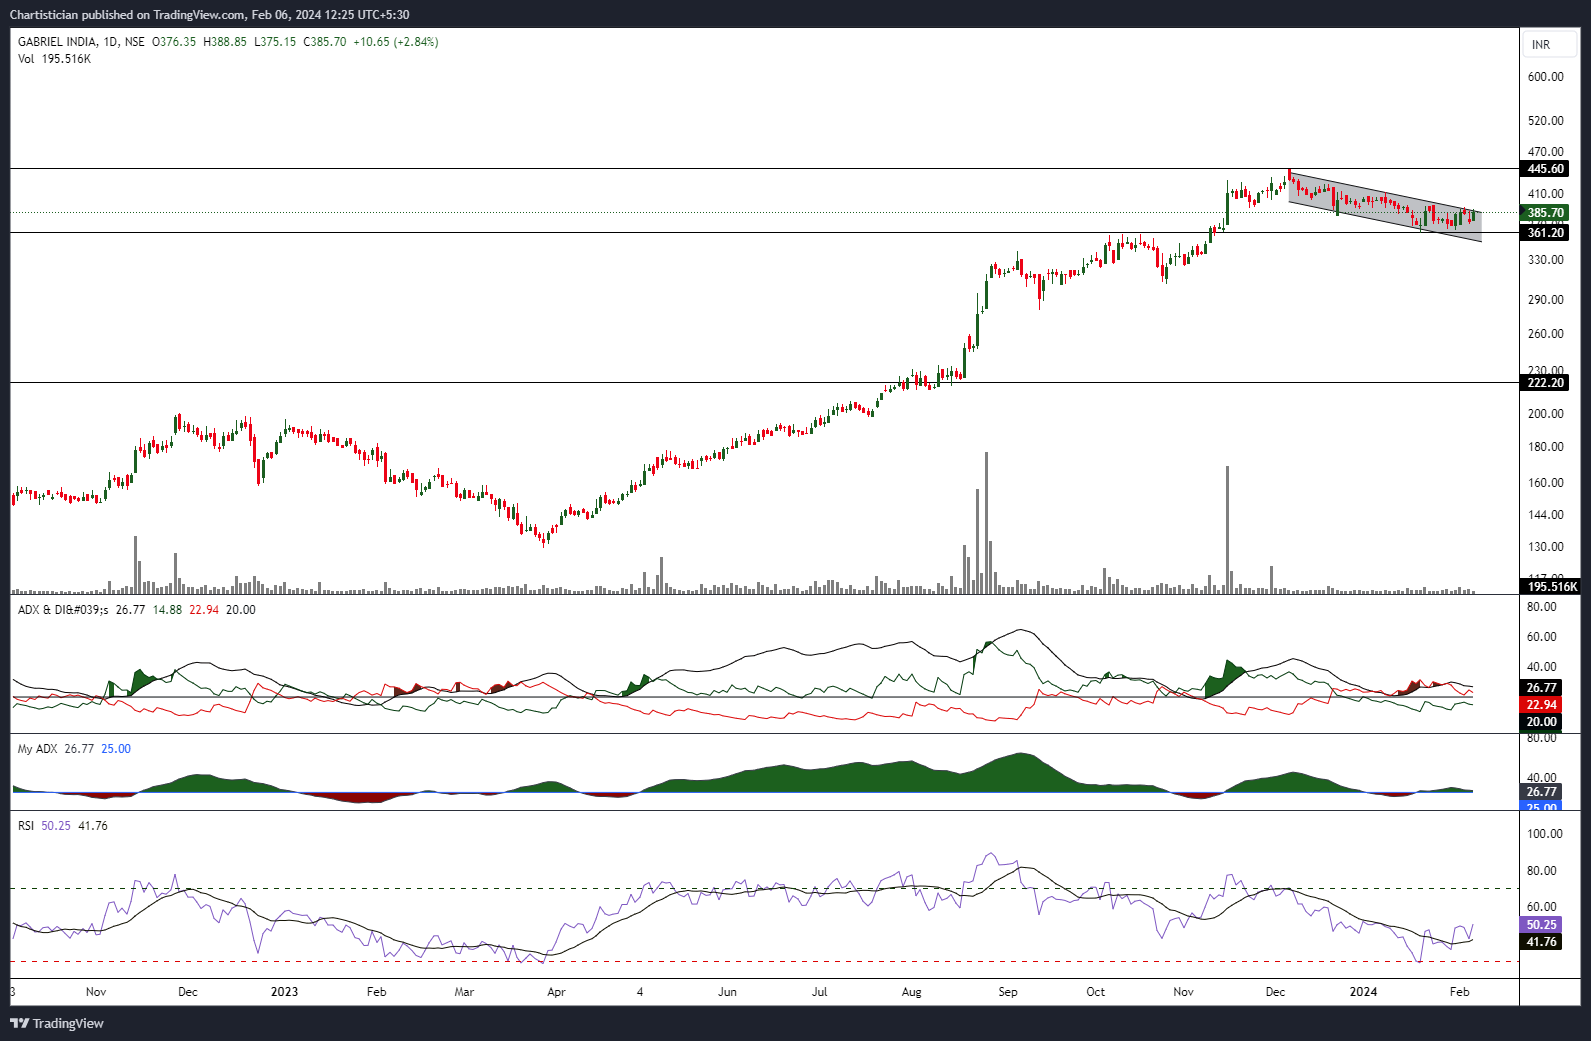

The stock follows a sideways correction in a tight channel after the recent run-up from 200-odd levels. The upward momentum is phenomenal on the back of active volume throughout the last half of 2023. The recent Sideways correction in stock is forming a short-term continuation pattern called a Flag.
The Flag is one of the most traded patterns sought after for short to mid-term trading or investing regarding trend following. The upside momentum, on average, is 60% if the pattern confirms specific key characteristics during its formation
The Gabrial India on the weekly chart seems to be well above its short-term 20 MA, mid-term 50 MA, and long-term 200 MA, indicating its upward trend is likely to continue. At the same time, the recent dip is an opportunity to enter the momentum.
The ADX, a trend strength indicator, has risen above 25, indicating the strength in the underlying bullish trend is gaining.
14 Period RSI, a momentum indicator, is above 50 and its 9 MA is also showing bullish price divergences since late January.
As far as Gabriel India is above 355, it can, in mid-term tests, reach higher levels of 445, its ATh, and beyond that, 520 – 540. The SL for this stock can be kept at 355 on a closing basis